

Go to: Financial -> Dashboards -> Client Profitability
Please see Using the Reports & Dashboards menu and managing favourites should the dashboard not be available in the menu.
This dashboard is grouped by default as follows: Business Group - Client - Job and Status

Initially 'Client Profitability' is presented by 'Business Group'. It is then possible to view profitability on a client or job level. For more information see How to work with Analysis Dashboards.
Generally speaking, 'Client Profitability' is best viewed over more than one month. Year-to-date 'Client Profitability' can be seen by selecting "Fin YTD" from the period drop-down on the date selector control (see below image).

The 'Operating Cost' per month should be input in order to correctly analyse 'Client Profitability'. If no 'Operating Cost' has been specified, then Insight will use the 'Default Overhead Multiplier' as described in the Help topic Setting up the Operating Costs.
The 'Operating Cost' is spread across clients according to the cost of time spent on each client, i.e. taking into account both time and the cost of staff recording timesheets.
The cost of a client is calculated as follows:
The following example shows two staff members that record time against two clients for a month:
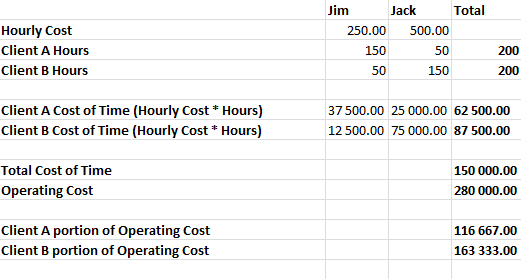
Here we can see that even though 200 hours were recorded against both Client A and B, Client B has a larger portion of the overhead cost allocated because the more expensive resource (Jack) spent more time at Client B.
Hourly Costs and Rates can be configured from Setup -> Employees, Rates & Costs p.h. tab. See Setup Employee Rates and Costs for more information.
For help on analysing Job Profitability, refer to How to Analyse Job Profitability in Chase Insight